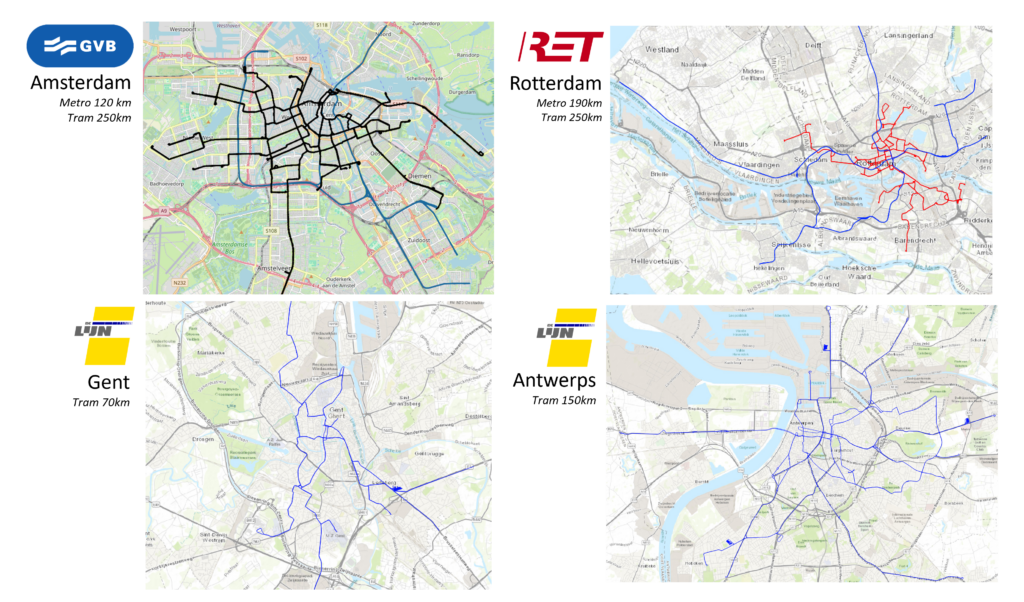
Part of our core business is creating and maintaining track models. These models are the basis for managing track data. They are the backbone of the data model in systems like RailDB, IRISSYS, RailCloud and RAMSYS. All measurement data is labelled with a specific location on a track model. We use satellite images, CAD drawings, Open Railway Maps and GPS data to create and maintain these models.
Maintenance on the map
Many asset owners possess large amounts of maintenance information. However this data is often hidden away in excel sheets and databases and is not very accessible. Nonetheless maintenance information is very useful in decision making processes. So how to fix this problem?
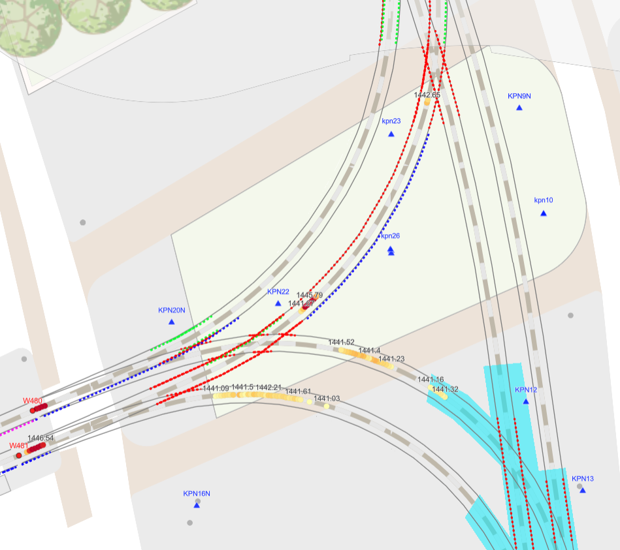
What we do is take the maintenance data, couple it to the track model and publish it in a GIS service. The picture here is a nice example for the tram rails in Rotterdam. On the tram rails a lot of welding maintenance (dotted lines) is carried out to extend the life time of rails. Additionally rails are replaced for whole street sections (blue polygon). This gives a very effective overview of all activities that influenced the rails.
Free space profiles
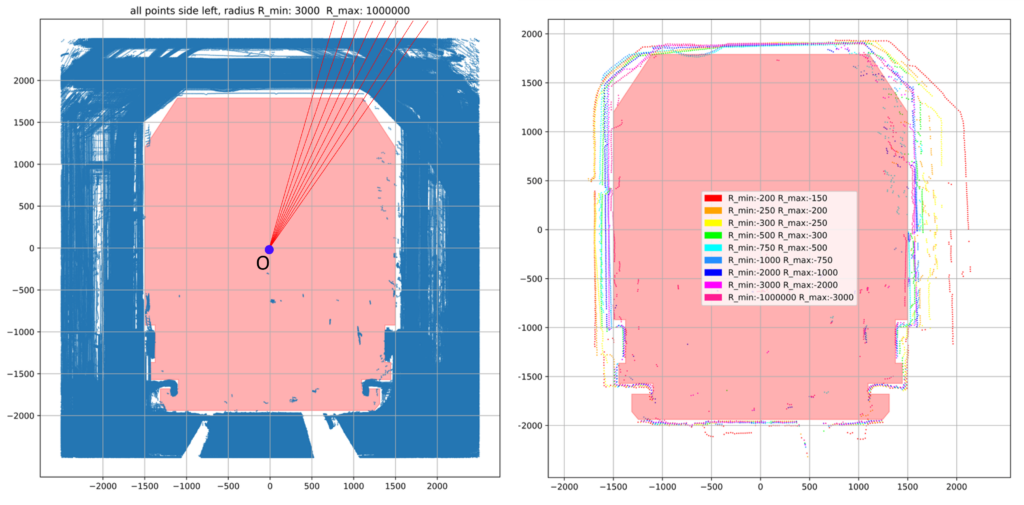
Here we faced another question. Namely what is the minimal available space for metros in tunnels per curve radius. So what we did was take all the available pointcloud data and coupled it to the local curve radius data. Next we took all point cloud slices at a specific curve radius and put all slices on top of each other. This is the picture on the left. Then we used polar coordinates to find the minimal available space in the tunnels over all pointcloud slices. Finally we created the picture on the right. Here you see the minimal space per curve radius. This is a nice example on how to reduce literally a billion data points to a single useful image.
Vertical rail wear analysis
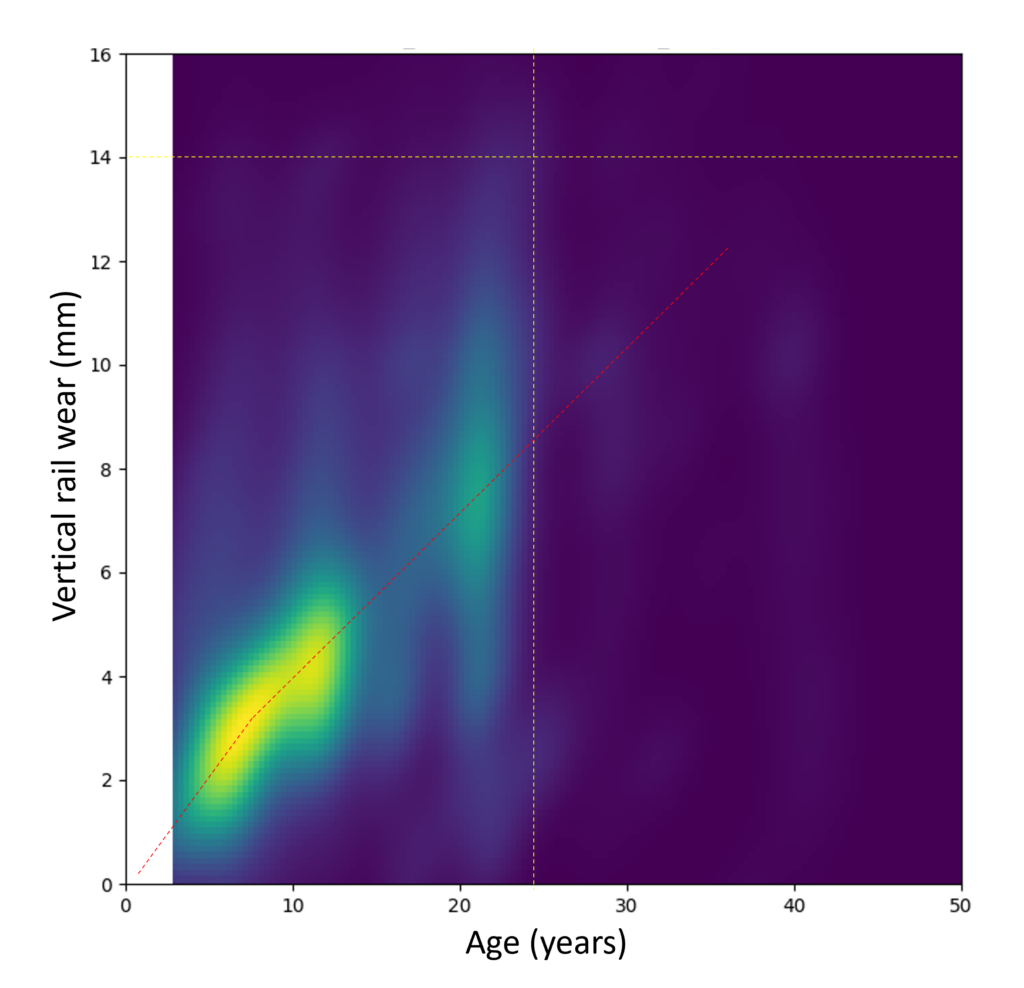
Here we made an analysis of vertical rail wear for tram tracks. This was used to get a general idea of how to model wear in predictive models. What we did was split the tracks in 1m segments. For all of the segments we determined the age and vertical wear. This is results in a large dataset that is shown in the density plot here. As can be seen it gives all kinds of interesting insights into the wear behaviour of the rails. These insights can be used to predict the state of the track far into the future.
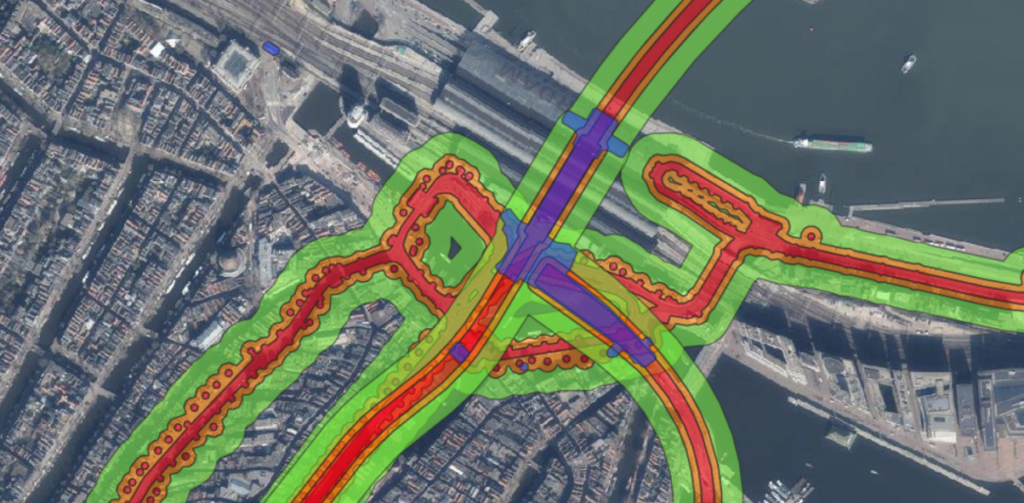
Permit maps
Here we created a map of specific zones along the track were contractors need to get a permit from the asset owner before they can commence their activities. This map was created with a rule-based algorithm that was applied to the track models in Amsterdam.